

治験の統括報告書の構成と内容に関するガイドライン
平成8年5月1日 薬審第335号
各都道府県衛生主管部(局)長あて 厚生省薬務局審査課長通知
STRUCTURE AND CONTENT OF CLINICAL STUDY REPORTS
Recommended for Adoption at Step 4 of the ICH Process on 30 November 1995 by the ICH Steering Committee
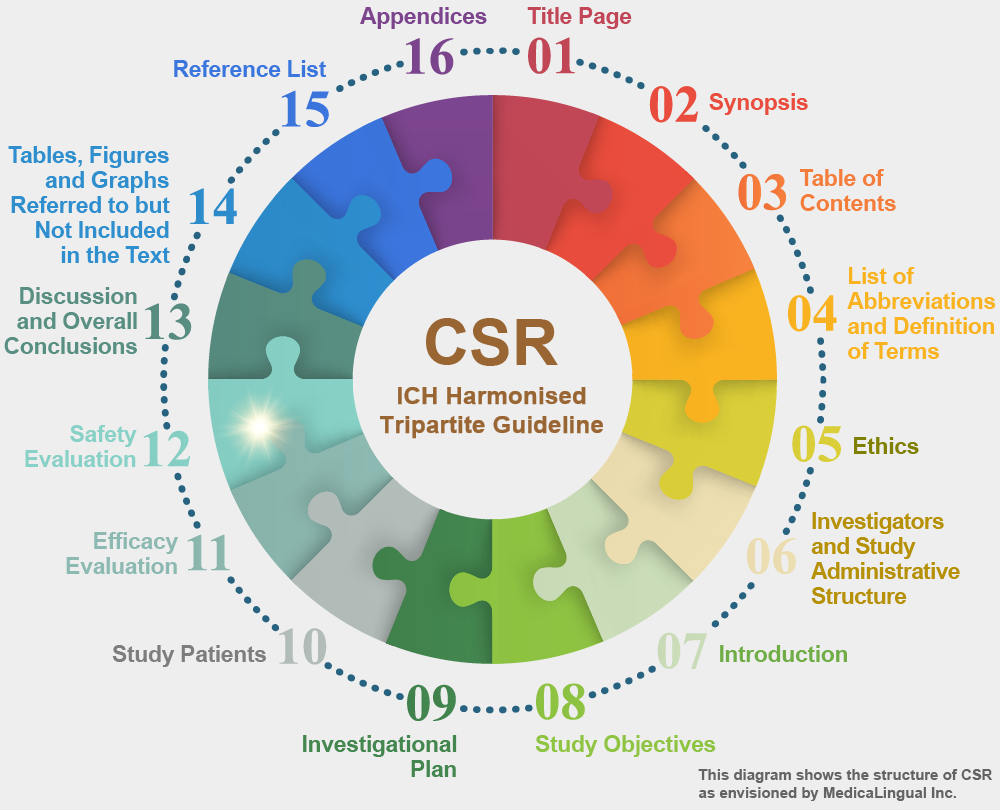
12. 安全性の評価
12.2 有害事象
12.2.3 有害事象の分析
報告書12.2.2項(14.3.1項)の有害事象の発現率の基本的な表示に基づき,被験薬群と対照群における事象発現率を比較すること。この分析では,治療群間の左右比較ができるように,事象の重症度分類及び因果関係類をひとまとめにするのがよい。さらに,通常は総括的な安全性の分析において実施するのがよいが,治験の規模及びデザインによって可能ならば,治験薬に関連すると思われる比較的よく見られる有害事象について,投与量及びmg/kg 若しくはmg/m2用量,投与法,治療期間,総投与量,年齢・性別・人種のような人口統計学的特性,腎機能などその他の治療前の特性,有効性の結果並びに薬物濃度との関係を調べることが役立つ。また,有害事象の発現時期及び持続期間を調べることも役立つこともある。治験の結果又は治験薬の薬理的特性によって,さらに様々な追加分析を実施すべきことが示唆される場合もある。
12. SAFETY EVALUATION
12.2 ADVERSE EVENTS (AEs)
12.2.3 ANALYSIS OF ADVERSE EVENTS
The basic display of adverse event rates described in section 12.2.2 (and located in section 14.3.1) of the report, should be used to compare rates in treatment and control groups. For this analysis it may be helpful to combine the event severity categories and the causality categories, leading to a simpler side-by-side comparison of treatment groups. In addition, although this is usually best done in an integrated analysis of safety, if study size and design permit, it may be useful to examine the more common adverse events that seem to be drug related for relationship to dosage and to mg/kg or mg/m² dose, to dose regimen, to duration of treatment, to total dose, to demographic characteristics such as age, sex, race, to other baseline features such as renal status, to efficacy outcomes, and to drug concentration. It may also be useful to examine time of onset and duration of adverse events. A variety of additional analyses may be suggested by the study results or by the pharmacology of the test drug/investigational product.
あらゆる有害事象について,厳密な統計的評価を行うことを意図しているのではない。単にデータを表示し詳しく見るだけで,人口統計学的特性やその他の基準値の特性に意味のある関連性がないことが明白になることもある。治験が小規模で,事象が比較的少なければ,被験薬と対照との比較に限った分析でも十分であろう。
It is not intended that every adverse event be subjected to rigorous statistical evaluation. It may be apparent from initial display and inspection of the data that a significant relation to demographic or other baseline features is not present. If the studies are small and if the number of events is relatively small, it may be sufficient to limit analyses to a comparison of treatment and control.
ある状況下では,単なる有害事象の発現率の報告よりも,生命表又は類似の分析の方がより多くの情報をもたらす。例えば,癌化学療法のように治療が周期的に行われる場合には,各周期ごとに結果を分けて表示することが有用であることもある。
Under certain circumstances, life table or similar analyses may be more informative than reporting of crude adverse event rates. When treatments are cyclical, e.g., cancer chemotherapy, it may also be helpful to analyse results separately for each cycle.
ガイドライン ― Q&A
Q17:「12.2.3有害事象の分析」に,「通常は総括的な安全性分析において実施するのがよいが,治験の規模及びデザインによって可能ならば,・・・」として,詳細な安全性の分析を要求しているが,これらの分析はどのような治験について記載すべきか。
A17:治験の規模及び有害事象の発現率による。詳細な分析が可能なほどの症例数の治験であり,かつ分析すべき有害事象が発現したのであれは,個々の治験においても分析することが必要になる。通常は,すべての治験の安全性データの分析において,詳細な安全性の分析を実施すれば十分であると思われる。
***