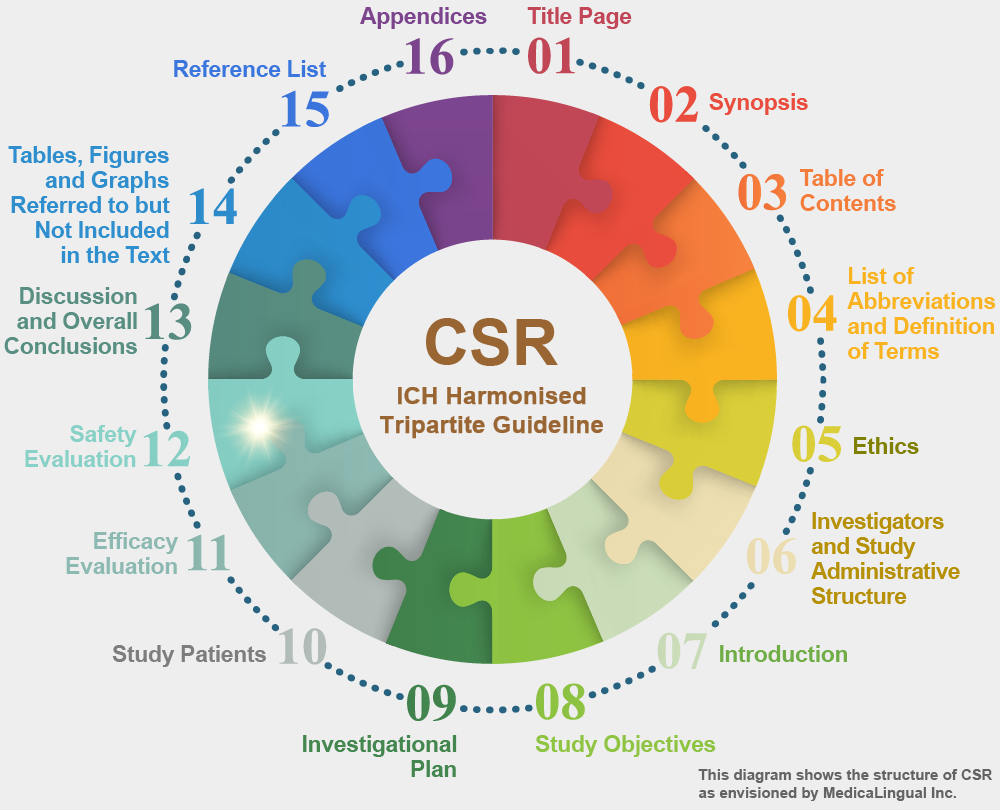
治験の統括報告書の構成と内容に関するガイドライン
平成8年5月1日 薬審第335号
各都道府県衛生主管部(局)長あて 厚生省薬務局審査課長通知
STRUCTURE AND CONTENT OF CLINICAL STUDY REPORTS
Recommended for Adoption at Step 4 of the ICH Process on 30 November 1995 by the ICH Steering Committee
12. 安全性の評価
12.4 臨床検査値の評価
12.4.2 各臨床検査項目の評価
臨床検査値に対する必要な評価の一部は,結果の値そのものから行うことができるが,一般的には次の分析を行うこと。それぞれの項目の分析で,(内容上)適切であり治験の規模からみて比較が可能であれば,被験薬群と対照群の比較を行うこと。さらに,臨床検査の正常範囲もそれぞれの項目の分析において提示すること。
12. SAFETY EVALUATION
12.4 CLINICAL LABORATORY EVALUATION
12.4.2 EVALUATION OF EACH LABORATORY PARAMETER
The necessary evaluation of laboratory values must in part be determined by the results seen, but, in general, the following analyses should be provided. For each analysis, comparison of the treatment and control groups should be carried out, as appropriate, and as compatible with study size. In addition, normal laboratory ranges should be given for each analysis.
12.4.2.1 治験期間を通しての臨床検査値
治験期間中の各時点(例えば,各来院時)における各値については,以下のものを記述すること:群の平均値又は中央値,値の範囲及び異常値を示した患者数又は特定の範囲(例えば,正常値範囲の上限の2倍,上限の5倍など;その選択について説明すること)の異常値を示した患者数。図を用いてもよい。
12.4.2.1 Laboratory Values Over Time
For each parameter at each time over the course of the study (e.g., at each visit) the following should be described: the group mean or median values, the range of values, and the number of patients with abnormal values, or with abnormal values that are of a certain size (e.g., twice the upper limit of normal, 5 times the upper limit; choices should be explained). Graphs may be used.
12.4.2.2 個々の患者の変化
治療群ごとの個々の患者の変化の分析を示すこと。以下のような多様な方法を用いてもよい。
Ⅰ.「シフトテーブル」-これは,治療前及び以降の選択された間隔の観察時点において,低値,正常値又は高値を示した患者数を示すものである。
Ⅱ. 選択された間隔の観察時点において,検査値に事前に決めた大きさの変化のあった患者数又は患者の割合を示す表。例えば,BUN については10mg/dl 以上の変化を示すことと決めることもできよう。通常は,治療前のBUN 値(正常又は高値)によって患者をグループ化し,この検査項目について,その大きさ未満又はその大きさ以上の変化を示した患者数を一つ又は複数の来院時点について示すことができる。通常のシフトテーブルに比べてこの表示の方が優れる点は,たとえ最終値が異常でなくてもある範囲の変化が示されることである。
Ⅲ. 初期値を横軸に,その後の値を縦軸に配置することにより,各患者について初期値及び治療中の臨床検査値を比較した図。もし変化がなければ,各患者を表す点は45°の線上に位置する。全般的に値が高い方に変化する場合は,点が45°の線の上側に見られる。この表示は,一つの治療法について一つの時点を示すのみであるので,解釈のためには被験薬群と対照群の両方について,これらのプロットを時系列的に反復する必要がある。別の表示方法は,基準値と治療中の最も極端な値を示すことである。この種の表示により,容易に外れ値を見出すことができる(外れ値に患者識別コードをつけることは有益である。
12.4.2.2 Individual Patient Changes
An analysis of individual patient changes by treatment group should be given. A variety of approaches may be used, including:
I. “Shift tables” – These tables show the number of patients who are low, normal, or high at baseline and then at selected time intervals.
II. Tables showing the number or fraction of patients who had a change in parameter of a predetermined size at selected time intervals. For example, for BUN, it might be decided that a change of more than 10 mg/dL BUN should be noted. For this parameter, the number of patients having a change less than this or greater than this would be shown for one or more visits, usually grouping patients separately depending on baseline BUN (normal or elevated). The possible advantage of this display, compared to the usual shift table, is that changes of a certain size are noted, even if the final value is not abnormal.
III. A graph comparing the initial value and the on-treatment values of a laboratory measurement for each patient by locating the point defined by the initial value on the abscissa and a subsequent value on the ordinate. If no changes occur, the point representing each patient will be located on the 45° line. A general shift to higher values will show a clustering of points above the 45° line. As this display usually shows only a single time point for a single treatment, interpretation requires a time series of these plots for treatment and control groups. Alternatively the display could show baseline and most extreme on-treatment value. These displays identify outliers readily (it is useful to include patient identifiers for the outliers).
12.4.2.3 個々の臨床的に重要な異常
臨床的に重要な変化(申請者により定義された)について考察すること。重篤な有害事象とみなされた臨床検査値異常,及び場合によっては,他の重要な有害事象とみなされた患者に関する叙述を12.3.2項又は14.3.3項に示すこと。毒性の重症度分類(例えば,WHO,NCI)を用いた場合は高度と評価された変化について,重篤であるかどうかに関係なく論ずること。臨床的に重要な変化の分析は,臨床検査値による中止例の要約とともに,各検査値ごとに示すこと。これらの変化の重要性と治療との関連の可能性を,例えば用量との関係,薬物濃度との関係,継続治療で消失,投与中止で消失,再投与で再発,併用療法の性質のような特徴を分析することにより評価すること。
12.4.2.3 Individual Clinically Significant Abnormalities
Clinically significant changes (defined by the applicant) should be discussed. A narrative of each patient whose laboratory abnormality was considered a serious adverse event and, in certain cases, considered an other significant adverse event, should be provided under sections 12.3.2 or 14.3.3. When toxicity grading scales are used (e.g., WHO, NCI), changes graded as severe should be discussed regardless of seriousness. An analysis of the clinically significant changes, together with a recapitulation of discontinuations due to laboratory measurements, should be provided for each parameter. The significance of the changes and likely relation to the treatment should be assessed, e.g., by analysis of such features as relationship to dose, relationship to drug concentration, disappearance on continued therapy, positive dechallenge, positive rechallenge, and the nature of concomitant therapy.


